Tourism Data Use Case

Key Figures of Source Markets
Dashboard
Dashboard Key Figures of Source Markets
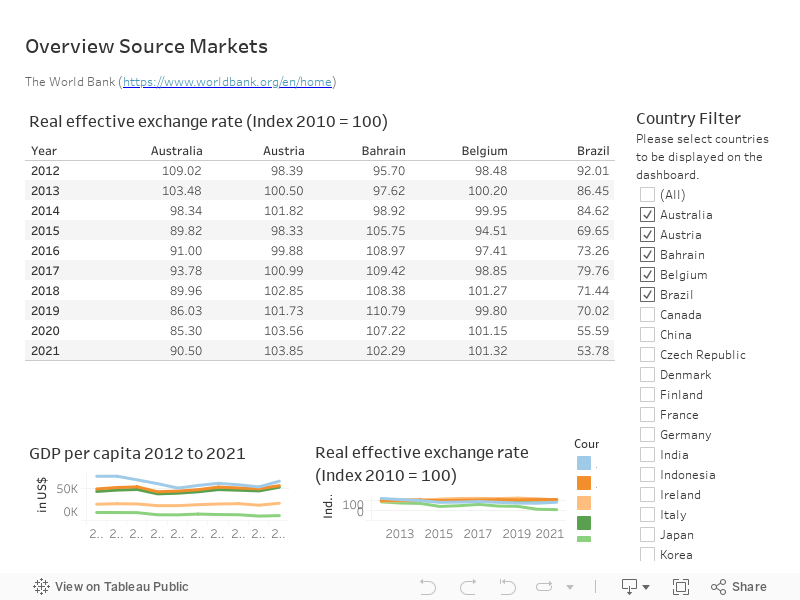
The dashboard below shows two key figures for source markets for Swiss tourism. It shows the Gross Domestic Product (GDP) and the exchange rate for each selected country. The figures are taken from the World Bank.
How to use the dashboard
Below are some tips on how to interact with the Dashboard to find answers to your questions:
- Click the rectangle icon in the bottom right corner to view the Dashboard full screen.
- Use the navigation at the top to access the different pages of the dashboard.
- The dashboard has filters that you can use to select specific data to display.
- Move your mouse over the information and numbers on the dashboard. Wherever the pointer changes to a hand, you can interact with the dashboard and make selections.
- Hovering over a time dimension (e.g. year) sometimes displays a plus/minus sign. Clicking on the icons allows you to view the data in finer/coarser temporal granularity.
- Use the drop-down menus to view specific metrics.
Do you want to work on another use case?
Do you have other idea how to use data in practice? We can discuss it. Please contact us.
")
This website was created as part of Resilient Tourism Project (Suproject 1: - National Data Infrastructure for Tourism). Resilient Tourism is one of 15 flagship projects approved and supported by the Innosuisse- Swiss Innovation Agency. Flagship projects are systemic and transdisciplinary innovations that are central to current and future economic and social challenges in Switzerland.